Make the life of a geochemist easier!
For handling the output data from numerical simulations (software: PHREEQC) I have written a Python-based application which reads-out the saturation index of all minerals at each time step. The user can define the threshold for the saturation index (e.g. SI = 0) by himself. The file can than be imported in Excel, resulting in a list and corresponding graphs for each mineral for the specific values.
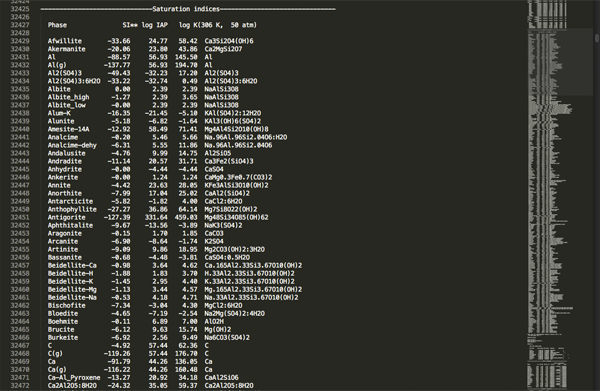
This is the PHREEQC output file.
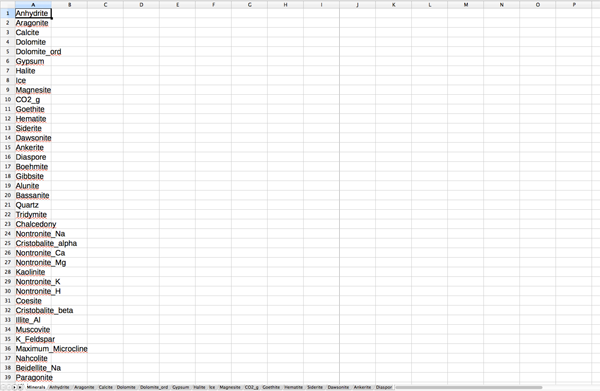
Here are the minerals, which are above the minimum SI selected by the user.
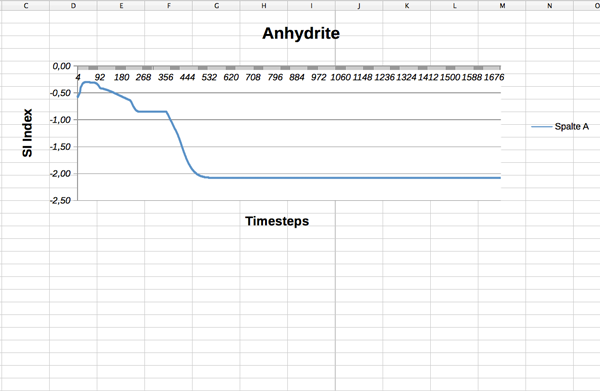
This is one of the minerals, which is represented as a line graph with the time steps and the corresponding SI.