Lectorlandia
Lectorlandia
Lectorlandia is a table, a projection, a visualization, a playground, a database, an idea, a feeling, and Lectorlandia is an interactive approach that brings people together!
It was developed by Wijnand Venenber, Machiel Veltkamp, Femmy Broer and me for stichting z25 and the HKU Utrecht.
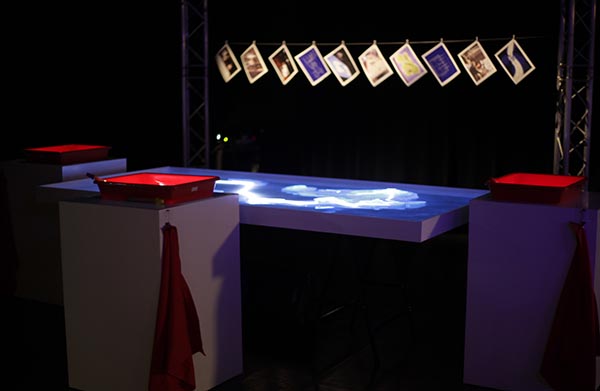
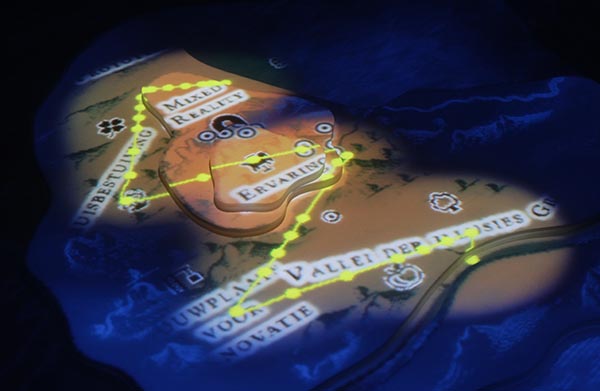
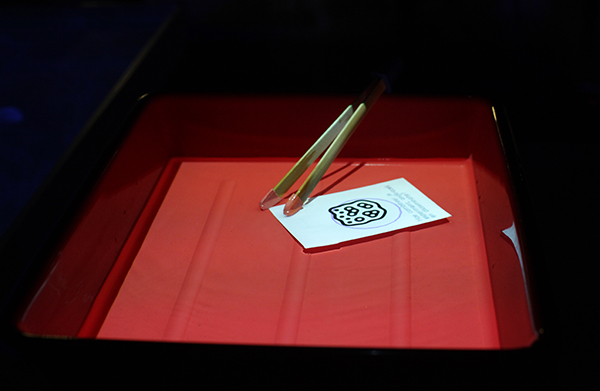
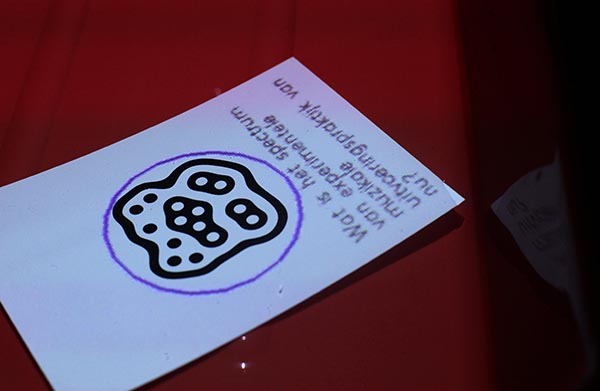
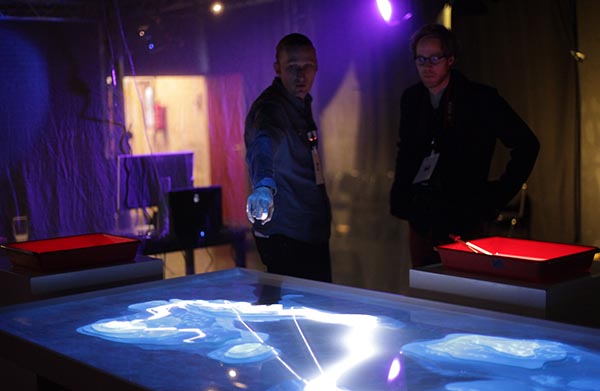
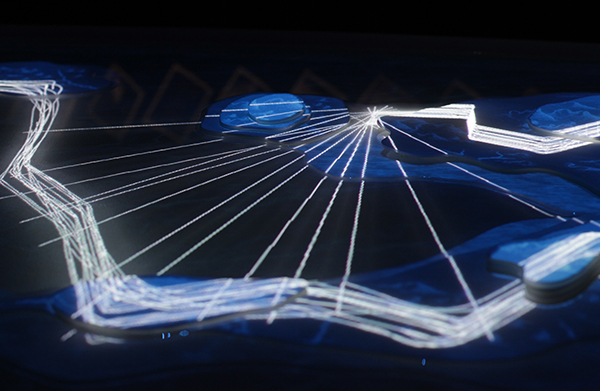
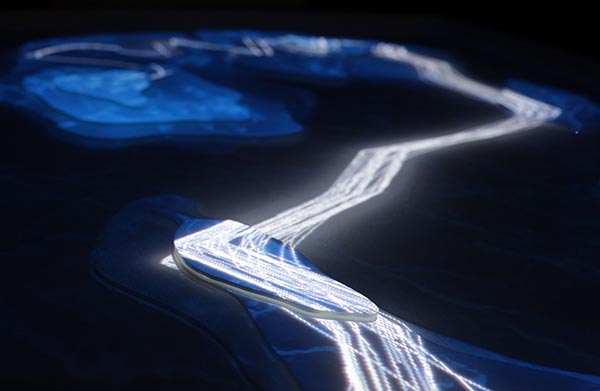
The user interface to Lectorlandia are the three developing trays. These trays were projected by a pico projector and filmed by a webcam. The webcam tracked the Fiducial ID, the position and rotation. The Information were send to the main Lectorlandia Unit, which creates the unique user data and projected them back on the table and the cardboard in the tray. This means, the user got a question on his cardboard. Also the position of the user, which he was moving during the last 15min gets visible as a path on the table.
A Mongo DB stored all the user data, including name, question, position and interest. The position was created by 6 open beacon readers placed in the building.
![]()
![]()
When a guest place his cardboard inside a tray it would be detected and trigger the visual software to get information back and create the user information on the table.
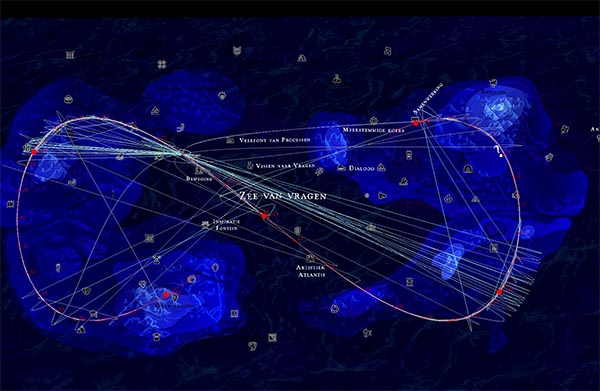
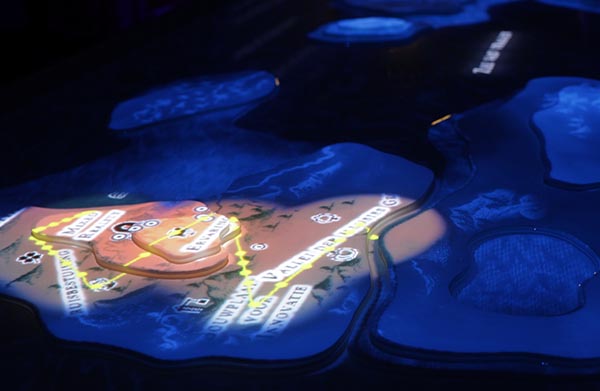
The visualization software was written in c++ with open frameworks to handle three parts. The first was to communicate with the fiducial tracker. Second to crate the mapping on the table and the third was to get the user information by the database. There are two modes at the table, one is no active user at any tray. Then the night map is shown and on tool there are all user paths from the last 30 minutes.
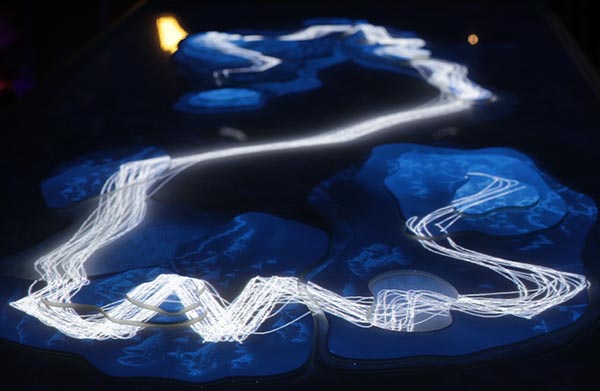
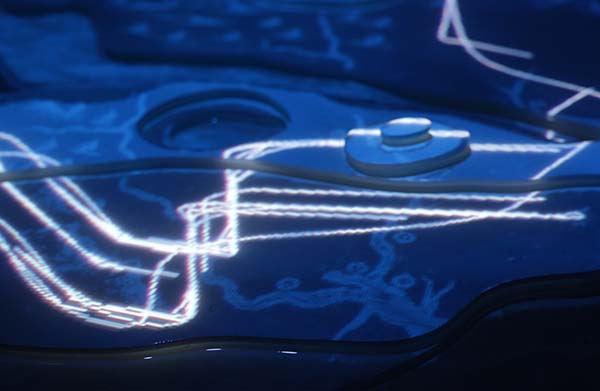
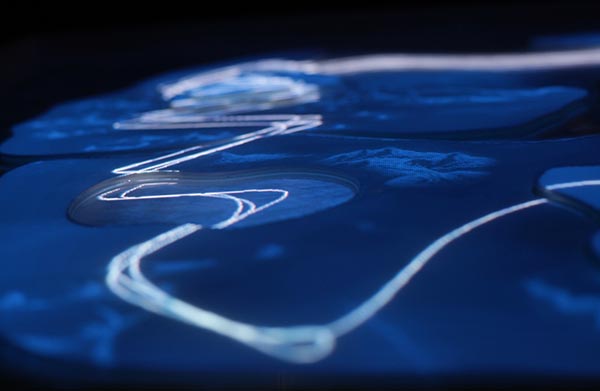
The Tables consist of 25 small islands cuted out of acrylic and glued together. The lowest part is filled with water.

![]()
The second mode is one or more active users.
Then the visualization shows the user information on the table and give feedback to the trays. Furthermore it sends some sound triggers for activation sound fx.